ProConnect’s new dashboards: WhatsApp marketing, AI conversations, eCommerce and Open Banking in one view
InsightTechnologyRob Mannion · 9 November 2026 · 6 min read
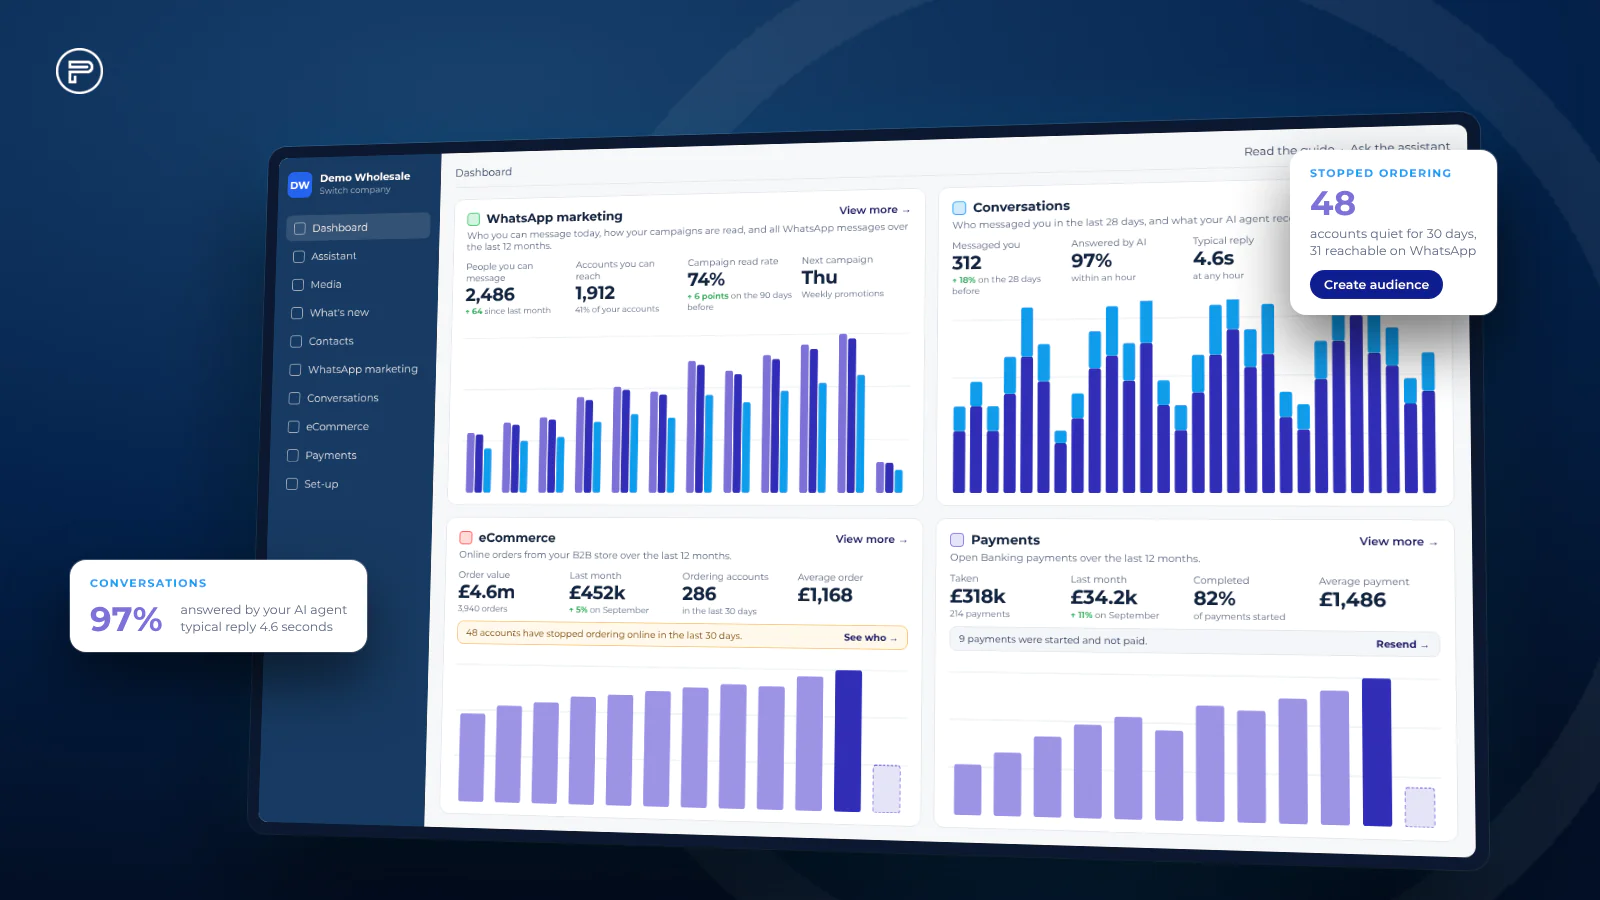
Every part of ProConnect now has its own dashboard: WhatsApp marketing, the two-way AI agent, eCommerce and Open Banking payments. Each one goes well beyond counting messages and orders, and each points straight to the next thing worth doing.
ProConnect has always held a great deal of data. A wholesaler running WhatsApp campaigns, an AI agent answering customers, a trade store and Open Banking payments on one platform generates a detailed picture of how every account behaves. Until now, very little of that picture was on screen. The reporting was basic, and the most useful questions needed an export and a spreadsheet.
That has changed. Here is what each dashboard now shows.
One dashboard, four cards
The main dashboard opens with a card for each part of ProConnect, side by side: WhatsApp marketing, Conversations, eCommerce and Payments. Each card carries the headline figures for that module and a chart of the last year or month. Selecting View more on any card opens its full dashboard. A daily Did you know? tip sits alongside, highlighting a feature worth trying.
WhatsApp marketing: who you can reach, and what gets read
The WhatsApp marketing dashboard starts with reach. It shows how many people you can message today, how many of your accounts have at least one of them, your campaign read rate against the previous 90 days, and when your next campaign is scheduled.
Messages over 12 months – sent, delivered and read, month by month.
How fast people read – the share of campaign messages read within five minutes, an hour, a day, or at all.
When to send – a grid of days and times showing which send slots get read quickest.
Your best campaigns – the last 90 days ranked by messages read, with clicks on tracked links and opt-outs alongside.
Opt-ins and opt-outs – who gave or withdrew marketing consent each month.
Who you can reach – your active accounts split into reachable, opted in but unreachable, and no one opted in, with a quick way to invite people at the accounts you can’t yet reach.
Conversations: what your AI agent is doing
The Conversations dashboard covers the two-way side of WhatsApp: customers messaging you, and the ProConnect AI agent answering them. It opens with the number of people and messages in the last 28 days, the share answered by the AI agent, its typical reply time, and how many messages arrived outside office hours.
Who’s messaging you – new people against people already linked to an account.
When people message you – by day and time, including how much arrives before 9am, after 6pm and at weekends.
What they send – text, photos, voice notes and files. The AI agent can see photos.
Most active people – who messages most, and how many days they message on.
What they asked for – the workflow records the AI agent created, such as orders, complaints or equipment requests, how many came from a campaign, and how completely each was filled in.
New people: what happened – what the agent recorded for people who are new to you.
Messages to check – voice notes and other messages that need a person, and campaign replies with nothing recorded, each one click from a follow-up.
eCommerce: who’s ordering, and who has stopped
The eCommerce dashboard draws on the longest-running data on the platform. Headline figures cover order value and order count over 12 months, last month against the month before, ordering accounts in the last 30 days, and the average order.
Who’s ordering – accounts split by when they last ordered: in the last 30 days, 31 to 90 days ago, or longer.
New and returning accounts – how many accounts order each month, and how many are ordering online for the first time.
Accounts that have stopped ordering – accounts that ordered in the 90 days before the last 30 and nothing since, biggest spenders first, with whether anyone there can be reached on WhatsApp. Create audience turns the list into a WhatsApp audience in one click; Export gives the full list.
When orders arrive – a grid of days and times across the year.
How often accounts reorder – the gap between an account’s orders, from same-day top-ups to over a month.
Top accounts – the biggest accounts by order value, and the share of value they bring in.
What sells – top products over 90 days by quantity, value and number of accounts buying.
Signed in, never ordered – accounts with an active store login that have never placed an online order.
Delivery and collection – the split between delivery and click and collect, and how far ahead accounts book their slot.
Payments: what Open Banking is bringing in
The Payments dashboard covers Open Banking payments taken through ProConnect. Headline figures show the total taken over 12 months, last month against the month before, the share of started payments that were completed, and the average payment.
Started and paid – payments started each month and how they ended up, with a prompt to resend the link for any that were started but not paid.
Payment sizes – the spread of payment values over the year.
When customers pay – by day and time.
Top payers – who pays you most, and how many pay more than once.
Every payment request is now listed in Payments, not just the latest 20, and can be filtered by status, the date it was created, or its reference.
Every chart comes with an answer
Each chart on every dashboard has a short line underneath saying what it shows in plain English – the busiest time to receive orders, how much of the AI agent’s work happens outside office hours, or how long a campaign takes to be read. The aim is that nobody has to interpret a chart to get the point.
From figure to action
The dashboards are built to lead somewhere. Accounts that have stopped ordering become a WhatsApp audience in one click. Accounts with no one opted in are a link away from an invitation. Unpaid payment links can be found and resent. Messages the AI agent couldn’t handle are one click from a person picking them up. Each card on the main dashboard links straight to the screen behind it.
Questions the dashboards now answer
Which accounts have gone quiet, and can we reach them?
What time of day do our campaigns get read fastest?
How much of our customer contact happens out of hours, and how quickly is it answered?
What are customers asking the AI agent for, and how much of it comes from campaigns?
Which products are selling, and to how many accounts?
How many started payments are actually completed?
Also new
The menu is grouped the way you work: Contacts, WhatsApp marketing, Conversations, eCommerce, Payments and Set-up.
Plainer names throughout: customers are now accounts, contacts are people, segments are audiences and tasks are workflows. Saved links still work.
AI features such as the knowledge base and submissions now sit under Conversations.
The platform is noticeably faster throughout.
The new dashboards are live for all ProConnect customers now. Each one shows only the modules you use. Your account manager can take you through them on your own data.